Remember my post “Five reasons not to directly query SharePoint databases” ? I have cautioned you more than once throughout it NOT to directly query SharePoint databases and I have mentioned its disadvantages and problems. If you haven’t read this post, I would encourage you to do that before carrying on.
I’m not contradicting myself! The first post was all about SharePoint 2007 but now I’m talking about the new and the amazing 2010 version of SharePoint.
So you might be asking “What the hell is SharePoint Logging Database?” Good question!
To answer you, please fire up the SQL Management Studio, and expand your databases. You’ll notice a new one named WSS_Logging.
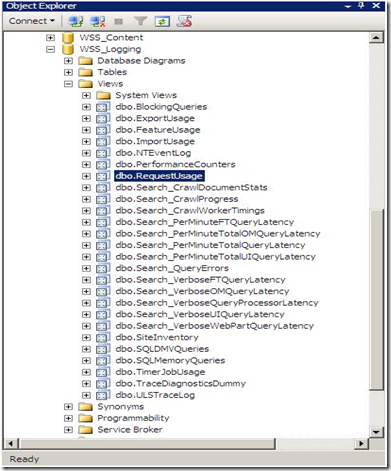
SharePoint 2010 keeps tracks of everything it does by logging into the WSS_Logging Database. It aggregates all of the raw logging data accumulated in the text files under the 14 hive and imports it into this wonderful logging database. This is the ONLY database in SharePoint that Microsoft will be happy to let the developers directly read, query and build reports against it. There is a bunch of useful views at your disposal, the one that I will show you now is the “RequestUsage” View.
Every time a user visit generates a page request, a record is inserted into one of the partitioned tables in this database and the “RequestUsage” view is kind enough to union all the data in the partitioned tables and presents it to you to consume in your custom solutions (Web Parts, Reports, Application Pages,…). An example is shown below :

Let’s dive a little bit deeper to see what happens behind the scenes and where this data come from.
1) Navigate SharePoint 2010 Central Administration > Monitoring > Configure usage and health data collection.
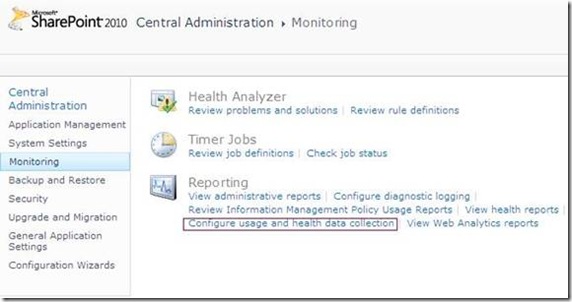


3) Did you notice the “Log Collection Schedule” section ? This implies that there is a timer job that collects the log files located under the 14 hive and copies the events you specify into your logging database which can be employed later for reporting purposes. You can even schedule this timer job based on the load patterns of your server as you will see in the next step.
4) I have opened up my favorite troubleshooting tool ( SharePoint Manager) 2010) to track this job. As you can see in the figure below, I have configured the “Microsoft SharePoint Foundation Usage Data Import” job from the central administration to run every minute.

5) Out of curiosity, I have decided to use .NET Reflector to check out how this timer job works, I have noticed two things.
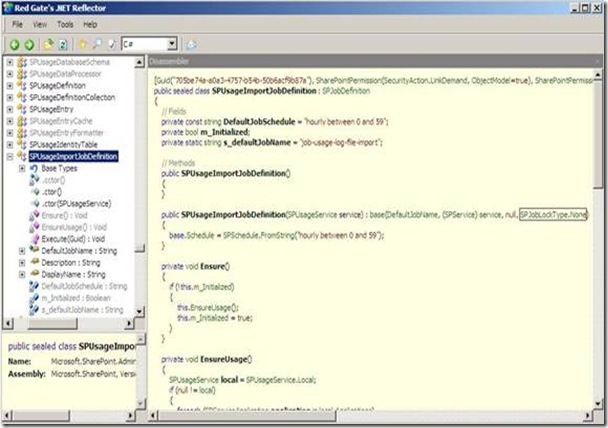
The first one is that the Job lock type specified in the constructor is SPJobLockType.None which instructs the Timer Service to run this job on all the Web Front Ends in the farm, this makes sense!
The difference between the Job and the None LockTypes is that the Job LockType ensures that the timer job only runs on one server but the None ensures that the job runs on every server.

